- Joined
- Aug 22, 2024
- Messages
- 39
Reading some of the reactions here, you’d think everyone expects Tecmo Bowl: call the right play, score a touchdown; call the right defense, force a turnover. Canes win 119-0.
Real opponents have good players and good coaches, too. They prepare, exploit, and make plays.
One reason I started paying closer attention to statistics was the 2017 season. Richt had us 10-0. We had just beat VT, ND and UVA convincingly in a row. I couldn’t understand why analysts weren’t seeing the beginning of another 2000-2003 run. Then came Pitt, Clemson, and Wisconsin. The turnover chain and the winning streak were fun, but analysts saw things I did not.
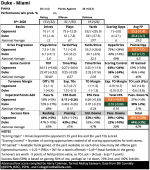
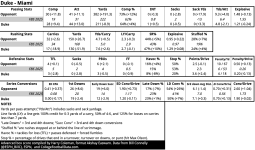
Here is advanced box score from Duke’s perspective and perhaps it can give us some insights we miss during the ups and downs of the game. The numbers in parentheses show how Duke's performance differed from its season averages entering the game. 1st: Duke finished with an 8% performance win expectancy. Yet much of the discussion centers on zero sacks, blown coverages, and Nate Sheppard two long runs and three endzone taunts. Not to mention blown blocking assignments, which I won't discuss as this is about the defensive performance and coaching.
Here’s what Miami’s defense accomplished during the game:
There are things to clean up. The explosive runs count. Duke finished its scoring opportunities. Its overall success rate was slightly above its season average. That's fair - but that's not what I hear. Miami dented their offense and defense performances, they bent to Miami's will. So yes, sign me up for holding Duke to 4.8 yards per pass attempt across 44 attempts over obtaining sack highlights.
Glossary
EPA - expected points added, is the difference between expected points after each play. A good play adds EPA and a bad play subtracts it. For instane a 4 yard agin on 3rd and 3 is adding while a 4 yard gain on 3rd and 7 is subtracting.
Success= Staying on schedule usually 50% of the yards to gain on 1st down, 70% on 2nd down and 100% on 3rd and 4th down. For example a series where you gain 1 yard on 1st down, fail; 6 yards on 2nd down, success; 2 yards on 3rd down, fail; 1 yard on 4th down, success - is 50% success.Scoring Opportunities - offense having a snap inside the defense's 35 yard line or scoring a touchdown from 36+
Havoc = tackles for loss, pass breakups and forced fumbles
Real opponents have good players and good coaches, too. They prepare, exploit, and make plays.
One reason I started paying closer attention to statistics was the 2017 season. Richt had us 10-0. We had just beat VT, ND and UVA convincingly in a row. I couldn’t understand why analysts weren’t seeing the beginning of another 2000-2003 run. Then came Pitt, Clemson, and Wisconsin. The turnover chain and the winning streak were fun, but analysts saw things I did not.
Here is advanced box score from Duke’s perspective and perhaps it can give us some insights we miss during the ups and downs of the game. The numbers in parentheses show how Duke's performance differed from its season averages entering the game. 1st: Duke finished with an 8% performance win expectancy. Yet much of the discussion centers on zero sacks, blown coverages, and Nate Sheppard two long runs and three endzone taunts. Not to mention blown blocking assignments, which I won't discuss as this is about the defensive performance and coaching.
Here’s what Miami’s defense accomplished during the game:
- 4.8 yards per pass attempt, down roughly 30% from Duke’s 6.9 average. Miami achieved that without sack yardage lowering the number.
- Duke's 130 yards rushing yards are down 52 yards from its average
- 24% runs were stuffed at or behind the line of scrimmage up 4% on Duke's average
- 0.07 passing Expected Points Average per play, down roughly 77% from Duke’s 0.30 average.
- 22% success on passing downs, down from 32%.
- 0.00 early-down EPA, down from 0.17 that Duke averages. Miami D's YTD average is 0.10 this is a huge win as FBS avg is 0.08
- Scoring opportunities on 40% of possessions, down from 54%.
- 16% havoc against Duke’s offense, up from the 12% its opponents had averaged.
- Six pass breakups, compared with the 3.9 Duke’s opponents had averaged, also 6 PBUs is double the amount Hurricanes avg YTD.
There are things to clean up. The explosive runs count. Duke finished its scoring opportunities. Its overall success rate was slightly above its season average. That's fair - but that's not what I hear. Miami dented their offense and defense performances, they bent to Miami's will. So yes, sign me up for holding Duke to 4.8 yards per pass attempt across 44 attempts over obtaining sack highlights.
Glossary
EPA - expected points added, is the difference between expected points after each play. A good play adds EPA and a bad play subtracts it. For instane a 4 yard agin on 3rd and 3 is adding while a 4 yard gain on 3rd and 7 is subtracting.
Success= Staying on schedule usually 50% of the yards to gain on 1st down, 70% on 2nd down and 100% on 3rd and 4th down. For example a series where you gain 1 yard on 1st down, fail; 6 yards on 2nd down, success; 2 yards on 3rd down, fail; 1 yard on 4th down, success - is 50% success.Scoring Opportunities - offense having a snap inside the defense's 35 yard line or scoring a touchdown from 36+
Havoc = tackles for loss, pass breakups and forced fumbles