Think it was you who mentioned possessions in regards to Mario and explosives, sorry if I am wrong, just adding here for reference..7 drives for 42 points against Stanford
7 drives for 49 points against FAMU.
I literally pretend like FAMU didn’t even happen. That is legitimately a high school team, no bull****.
But just for funsies, Darian Mensah has played in 14 drives and we have scored 91 points. LMAO.
That’s 6.5 points per drive. Anything above 4 is literally historic. Somewhere in the high 3’s leads the country every year. 3.8, 3.9…that’ll be best in America year over year. We are at 6.5 when Mensah plays
Just silly.
forums
You are using an out of date browser. It may not display this or other websites correctly.
You should upgrade or use an alternative browser.
You should upgrade or use an alternative browser.
CFB Analytics Thread 2026-27
- Thread starter AllAboutTheU
- Start date

OrangeBowlMagic
CEO
- Joined
- Jul 13, 2014
- Messages
- 20,919
Think it was you who mentioned possessions in regards to Mario and explosives, sorry if I am wrong, just adding here for reference..
Yep, that was me. That’s wild, I didn’t even realize it was that drastic. Mario 100% talked about it, though. Great post, thank you.
For sure, all the analytics guys and offensive guys also seem to care about two things and say that will win majority of games, explosive plays and turnovers. With limited possessions, explosives become more valuable so Mario is definitely hip on the latest trends but with two high and now 3 high safeties putting a cap on things, makes it that much harder as that trend makes the rounds..Yep, that was me. That’s wild, I didn’t even realize it was that drastic. Mario 100% talked about it, though. Great post, thank you.
Everyone cant have a light box like they are Seahawks/'23 mich/Ravens but most people arent patient now to pound it down field, which made our '25 team a pain to deal with because we were very comfortable with it because that was our path to victory..

cookies
All ACC
- Joined
- Feb 21, 2021
- Messages
- 8,656
Week 3
Other graphics are good however not sure i can take serious a model that says ND has a better offense than us; or Louisville for that matter
Edit: sees 25% preseason blend too

Im just posting, not agreeing with every model..Other graphics are good however not sure i can take serious a model that says ND has a better offense than us; or Louisville for that matter
Edit: sees 25% preseason blend too

cookies
All ACC
- Joined
- Feb 21, 2021
- Messages
- 8,656
Think this may be my favorite niche stat
cookies
All ACC
- Joined
- Feb 21, 2021
- Messages
- 8,656
I know playa, I’m shadow boxing the makers of itIm just posting, not agreeing with every model..

CaneMutiny06
Sophomore
- Joined
- Nov 3, 2011
- Messages
- 1,797
Other graphics are good however not sure i can take serious a model that says ND has a better offense than us; or Louisville for that matter
Edit: sees 25% preseason blend too
While I do like tracking all these, the metrics will start to show a more accurate tale in 2 more weeks after most teams will have a couple conference games played.
cookies
All ACC
- Joined
- Feb 21, 2021
- Messages
- 8,656
Agreed.While I do like tracking all these, the metrics will start to show a more accurate tale in 2 more weeks after most teams will have a couple conference games played.
In basketball right now, there are quite a few analytical measures that are just bad in general because of their inputs; but they have descriptive names so people think they mean something profound lol.
Be trying to find the good stuff and put it in one place..Think this may be my favorite niche stat
This one for just week 3 shows how we fell off cliff in 2nd half
CaneMutiny06
Sophomore
- Joined
- Nov 3, 2011
- Messages
- 1,797
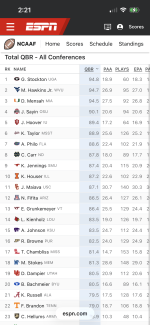
one of the ones I like looking which has a very high correlation to the NC race is QBR.

Going back to 2013, here is how each of the national title winners starting QBs (at least those who started for the majority of the season) finished in QBR:
2025: 3rd
2024: 1st
2023: 3rd
2022: 4th
2021: 3rd
2020: 1st
2019: 1st
2018: 8th
2017: 7th
2016: 5th
2015: 32nd
2014: 2nd
2013: 1st
Some context:
The ONLY major outlier was Jake Coker in 2015 during Derrick Henry’s Heisman year. The next “lowest” was 2018 Clemson with Trevor Lawrence and he didn’t start until several games into the season because they were still playing Kelly Bryant. In 2017 Jalen Hurts finished 7th before getting yanked in the NC game for Tua.
Basically, if you want to win a national title in the playoff era, your starting QB pretty much has to finish in the top 5 in QBR.
Going back to 2013, here is how each of the national title winners starting QBs (at least those who started for the majority of the season) finished in QBR:
2025: 3rd
2024: 1st
2023: 3rd
2022: 4th
2021: 3rd
2020: 1st
2019: 1st
2018: 8th
2017: 7th
2016: 5th
2015: 32nd
2014: 2nd
2013: 1st
Some context:
The ONLY major outlier was Jake Coker in 2015 during Derrick Henry’s Heisman year. The next “lowest” was 2018 Clemson with Trevor Lawrence and he didn’t start until several games into the season because they were still playing Kelly Bryant. In 2017 Jalen Hurts finished 7th before getting yanked in the NC game for Tua.
Basically, if you want to win a national title in the playoff era, your starting QB pretty much has to finish in the top 5 in QBR.
Attachments
cookies
All ACC
- Joined
- Feb 21, 2021
- Messages
- 8,656
Be trying to find the good stuff and put it in one place..
This one for just week 3 shows how we fell off cliff in 2nd half
Two things jump out beside your comment/Mensah’s positioning.
1st, Mason H at Pitt is massively overrated and people have given credibility to Narduzzi because of Kenny Pickett, i guess. I told two buddies that I’d take Gio Lopez over him easily.
2nd, their loss to Clemson should be a wake up call for Petrino and Bill B that Billy Edwards has to be benched sooner or later. Putting way too much pressure on the defense and running game, and that UNC is leading themselves vulnerable in ways that they wouldn’t be in the NFL because of the randomness and variability in college.
Overall, everyone across the board has locked into the fact that interceptions have an outsized effect on the game. What i mean by that is, it leads to higher completion percentages, but that doesn’t always mean good quarterback play is occurring, i.e. case in point:
Tait Reynolds & John Mateer well below that EPA/play crossing line but doing well on completion percentages. Can make the data a bit harder to parse as we see Sam Leavitt and Trinidad Chambliss right next to each other on this graph
cookies
All ACC
- Joined
- Feb 21, 2021
- Messages
- 8,656
Jacurri Brown didn’t make the cut.one of the ones I like looking which has a very high correlation to the NC race is QBR.
View attachment 373632
Going back to 2013, here is how each of the national title winners starting QBs (at least those who started for the majority of the season) finished in QBR:
2025: 3rd
2024: 1st
2023: 3rd
2022: 4th
2021: 3rd
2020: 1st
2019: 1st
2018: 8th
2017: 7th
2016: 5th
2015: 32nd
2014: 2nd
2013: 1st
Some context:
The ONLY major outlier was Jake Coker in 2015 during Derrick Henry’s Heisman year. The next “lowest” was 2018 Clemson with Trevor Lawrence and he didn’t start until several games into the season because they were still playing Kelly Bryant. In 2017 Jalen Hurts finished 7th before getting yanked in the NC game for Tua.
Basically, if you want to win a national title in the playoff era, your starting QB pretty much has to finish in the top 5 in QBR.
Opponents’ qbs currently outside the top 50: Pitt (55), UNC (71), Stanford (78), CMU (104) Boston College (112), Duke (131) and Clemson (133),
Opponents within the top 50 currently: Wake Forest (34), FSU (32), VT (13) and ND (8)